| |
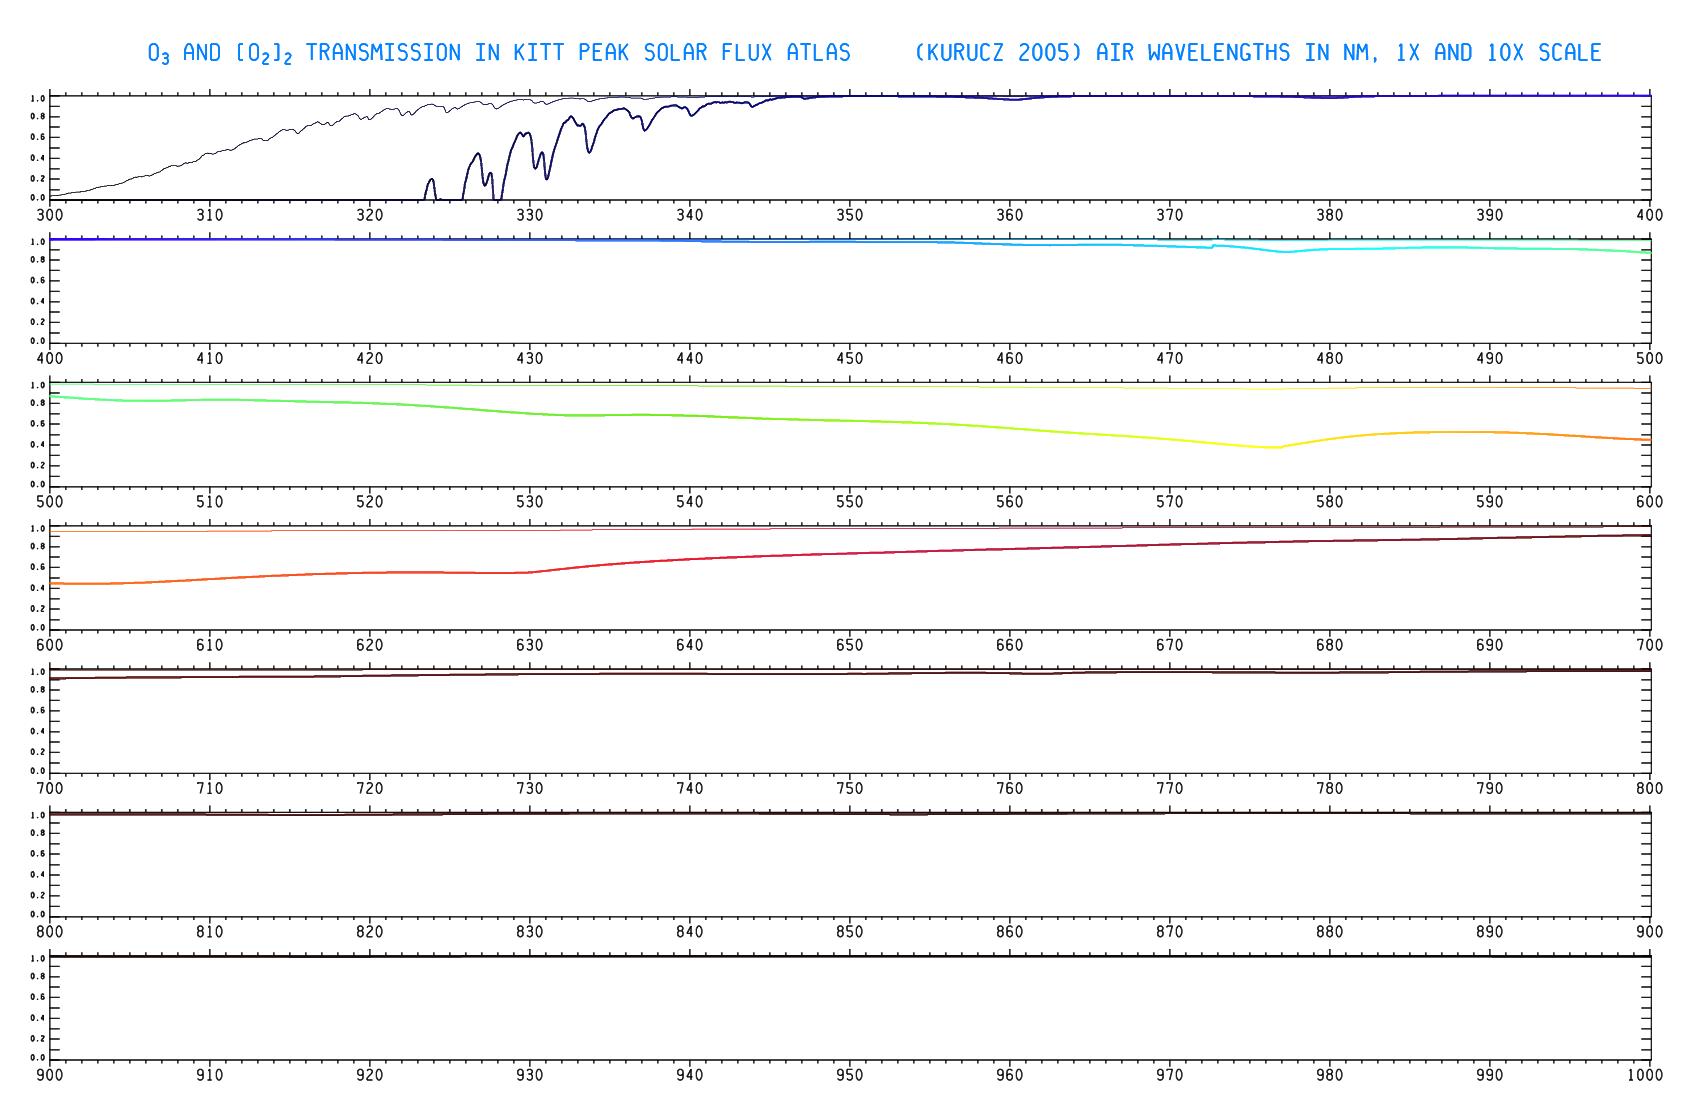
The blue end of one of the FTS scans is shown in green. A
continuum, smooth green line, is subjectively fitted to the scans by
comparing to predictions from calculations of the solar spectrum and
the telluric spectrum. When a reasonable looking fit has been obtained
through iteration, the spectrum is divided by the continuum value to
produce a residual spectrum shown in red. The top 1 percent of the
residual spectrum is replotted in red as well. The blue curve is the
the transmission curve for O_3 and [O_2]_2 that has already
been divided out.
|
|